What Is a Marketing Dashboard? A Guide with Examples
Learn what a marketing dashboard is, its key components, and how to build one to track KPIs and drive data-driven decisions for your team.
What Is a Marketing Dashboard?
A marketing dashboard is a centralized, visual reporting tool that consolidates your most important marketing data into a single, easy-to-understand display. It acts as a command center for your marketing efforts, transforming raw data from various sources into actionable insights. As defined by industry sources, it is a business intelligence tool used to bring all of your organisation's most valuable marketing metrics together into a single display and a visual reporting tool that takes incoming data and turns it into more immediately useful information. In essence, it answers the critical question: "How are our marketing activities performing?"
Core Components of an Effective Dashboard
A powerful marketing dashboard is more than just a collection of charts. It is built on a foundation of clear objectives and relevant data. The most effective dashboards share several key components.
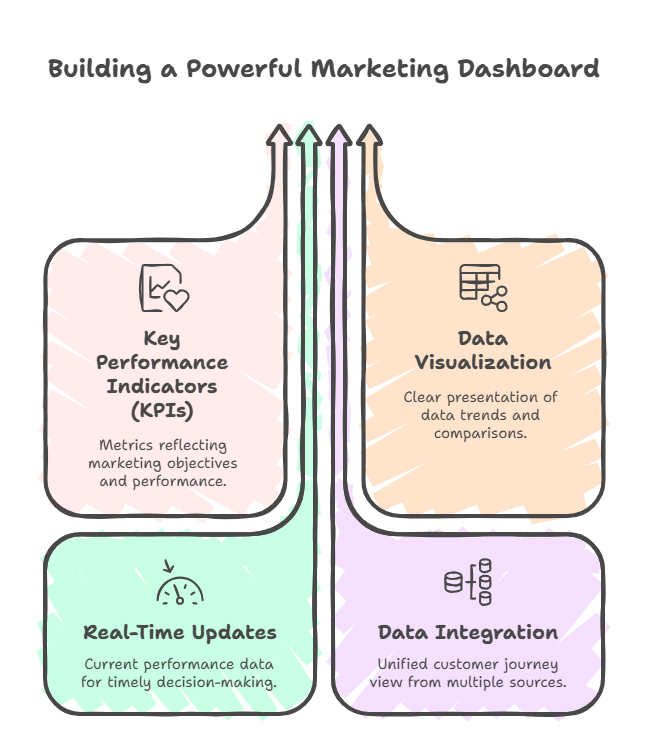
- Key Performance Indicators (KPIs): These are the heartbeat of your dashboard. Common examples include website traffic, conversion rates, cost per lead, customer acquisition cost (CAC), return on ad spend (ROAS), and social media engagement. Your chosen KPIs should directly reflect your marketing goals.
- Data Visualization: This is how you make data understandable. Effective dashboards use charts, graphs, gauges, and tables to present trends, comparisons, and progress at a glance. Good visualization turns complex data sets into clear stories.
- Real-Time or Frequent Updates: To be truly actionable, a dashboard must reflect current performance. Many modern tools offer real-time displays of your marketing metrics and key performance indicators, allowing teams to react quickly to opportunities or issues.
- Data Integration: A dashboard pulls information from multiple sources—your CRM, Google Analytics, social media platforms, email marketing software, and ad networks. This integration creates a unified view of the customer journey across all touchpoints.
Common Types and Examples
Marketing dashboards can be tailored to different audiences and purposes. Here are a few common types you might build or encounter.
- Executive Dashboard: Provides a high-level overview of top-line metrics like overall revenue influenced by marketing, pipeline growth, and brand health. It’s designed for quick, strategic decision-making.
- Channel-Specific Dashboard: Dives deep into a single marketing channel. For example, a Social Media Dashboard might track followers, engagement rate, and top-performing posts, while a SEO Dashboard focuses on organic traffic, keyword rankings, and backlink profile.
- Campaign Performance Dashboard: Tracks the effectiveness of a specific marketing campaign across all channels, measuring metrics like impressions, clicks, conversions, and overall ROI against the campaign budget.
- Funnel Dashboard: Visualizes the customer journey from awareness to purchase, highlighting conversion rates at each stage (e.g., visitor to lead, lead to opportunity, opportunity to customer). This helps identify bottlenecks in the sales process.
How to Build Your Marketing Dashboard
Creating a dashboard is a strategic process, not just a technical task. Follow these steps to ensure your dashboard delivers value.
- Define Your Goals and Audience: Start by asking, "What decisions will this dashboard inform?" and "Who will use it?" The needs of a CMO are different from those of a content manager. A dashboard should present the most relevant information necessary to achieve one or more objectives.
- Select Your KPIs: Choose 5-10 metrics that directly correlate to your defined goals. Avoid vanity metrics; focus on indicators that drive business outcomes.
- Gather and Connect Your Data Sources: Identify where your data lives (Google Analytics, Facebook Ads, HubSpot, etc.) and use a dashboard tool that can integrate these sources seamlessly.
- Design the Layout and Visuals: Organize the most critical KPIs at the top. Group related metrics together (e.g., all website performance stats in one section). Choose the right chart type for each data set—line charts for trends over time, bar charts for comparisons, and gauges for goal progress.
- Iterate and Refine: A dashboard is never truly "finished." Regularly review it with your team to ensure the data is accurate, relevant, and actionable. Remove metrics that are no longer useful and add new ones as strategies evolve.
Benefits of Using a Marketing Dashboard
Implementing a well-designed marketing dashboard delivers tangible benefits that streamline operations and improve results.
- Saves Time: Eliminates the need to manually log into a dozen different platforms and compile reports. Data is aggregated automatically.
- Improves Decision-Making: Provides a single source of truth, enabling faster, data-driven decisions rather than guesses or assumptions.
- Enhances Team Alignment: When everyone views the same data, it creates shared context and accountability for marketing performance.
- Identifies Trends and Issues: Visualizations make it easy to spot positive trends to double down on, or negative dips that require immediate attention.
- Demonstrates Marketing's Value: Clearly connects marketing activities to business outcomes like leads, opportunities, and revenue, proving ROI to stakeholders.
A marketing dashboard is an indispensable tool for any modern marketing team. It transforms scattered data into a coherent narrative about your performance. By providing a visual representation of key performance indicators, it empowers you to track progress, optimize campaigns, and strategically guide your marketing efforts toward success.
For visual thinkers who plan strategies and analyze data, organizing your dashboard framework can be greatly enhanced with a mind map. Tools like ClipMind allow you to visually structure your KPIs, data sources, and reporting logic before you even build the dashboard, ensuring a logical and comprehensive approach.