How to Use RICE Scoring for Feature Prioritization
Learn how to use the RICE framework (Reach, Impact, Confidence, Effort) to prioritize product features with data-driven decisions and maximize ROI.
What Is RICE Scoring?
RICE scoring is a prioritization framework that helps product teams make data-driven decisions about what to build next. The acronym stands for Reach, Impact, Confidence, and Effort—four factors that collectively determine which features or projects deserve priority. Developed by Intercom, this framework helps teams evaluate projects based on four factors to ensure resources are invested in initiatives offering the greatest impact for the effort required.
Unlike subjective prioritization methods, RICE provides a quantitative approach that reduces bias and creates objective comparisons between competing initiatives. The framework quantifies intangible values through a mathematical formula, giving you numerical scores you can use to create hierarchical prioritization.
The Four Components of RICE
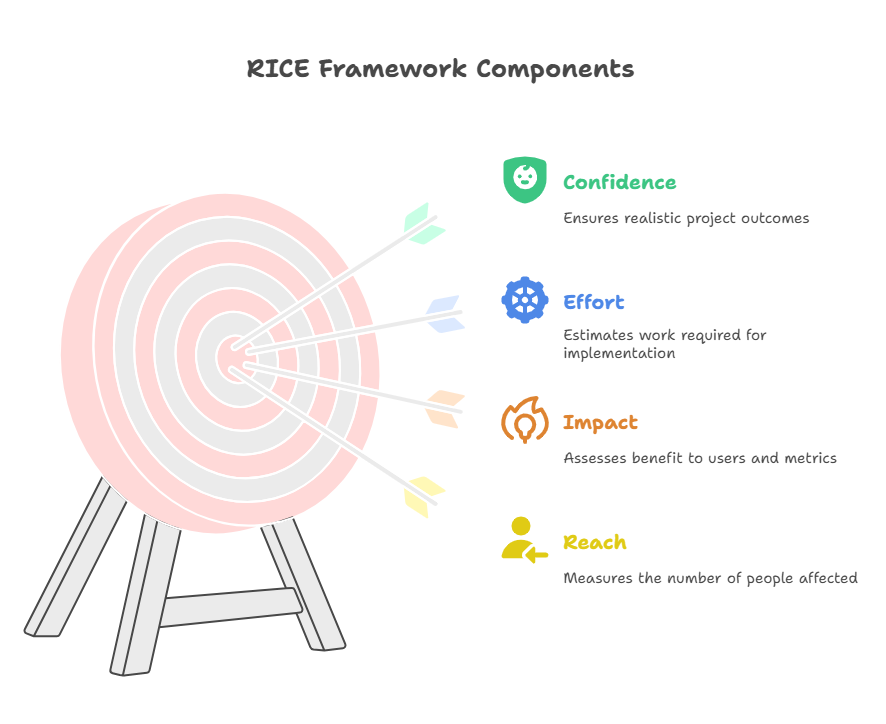
Reach
Reach measures how many people will be affected by a feature within a specific timeframe. This could be the number of users, customers, or transactions impacted per month or quarter. For example, a feature that affects 50% of your user base has higher reach than one affecting only 5%.
When estimating reach, consider:
- Number of users who will interact with the feature
- Frequency of interaction
- Time period (typically measured per month or quarter)
Impact
Impact assesses how much a feature will benefit users or move key metrics when they encounter it. This is often the most challenging component to quantify. Many teams use a simplified scale:
- 3 = massive impact
- 2 = high impact
- 1 = medium impact
- 0.5 = low impact
- 0.25 = minimal impact
Impact should reflect how much the feature advances your product goals, whether that's user retention, conversion rates, or customer satisfaction.
Confidence
Confidence represents how certain you are about your estimates for reach, impact, and effort. This acts as a reality check on your assumptions. Teams typically use percentage brackets:
- 100% = high confidence (supported by solid data)
- 80% = medium confidence (based on reliable estimates)
- 50% = low confidence (best guess)
As the RICE framework documentation notes, this factor ensures you're not overcommitting to projects with uncertain outcomes.
Effort
Effort estimates the total work required to implement a feature, typically measured in person-months. This includes design, development, testing, and deployment. One person-month represents one team member working full-time for one month.
Accurate effort estimation requires input from your development team and should account for all phases of implementation, not just coding time.
Calculating RICE Scores
The RICE score formula is straightforward: (Reach × Impact × Confidence) ÷ Effort = Total Score
Let's break this down with an example:
- Reach: 5,000 users per month
- Impact: 2 (high impact)
- Confidence: 80% (0.8)
- Effort: 3 person-months
Calculation: (5,000 × 2 × 0.8) ÷ 3 = 2,667
Higher scores indicate better prioritization candidates because they deliver more value relative to the effort required. After calculating scores for all potential features, you can sort your view by RICE score to decide what to build next.
Implementing RICE in Your Workflow
Step 1: Brainstorm and List Features
Start by compiling a comprehensive list of potential features, improvements, and projects. Include everything from major initiatives to minor tweaks. This ensures you're considering all opportunities rather than just the loudest requests.
Step 2: Score Each Component
Gather your product team, developers, and relevant stakeholders to score each feature against the four RICE components. Use available data for reach estimates, customer feedback for impact assessment, and technical expertise for effort estimation.
Step 3: Calculate and Compare
Calculate the final RICE score for each feature using the formula. Then, compare the scores and arrange your features in order of priority. The features with the highest scores become your development priorities.
Step 4: Review and Refine
RICE scoring isn't a one-time exercise. Regularly review your scores as you gather new data about user behavior, market conditions, and technical constraints. Update your confidence scores as assumptions are validated or disproven.
Benefits of RICE Prioritization
The RICE framework offers several key advantages for product teams:
Data-driven decision making: By quantifying subjective factors, RICE reduces personal bias and emotional arguments about what to build next.
Resource optimization: The framework helps you allocate resources more efficiently by considering variables like effort, impact, and potential return, allowing you to focus on high-yield initiatives.
Transparent prioritization: With clear scoring criteria, everyone understands why certain features are prioritized over others, reducing internal conflicts.
Flexible application: While designed for product features, RICE can be adapted for marketing campaigns, process improvements, or any project requiring prioritization.
Common Challenges and Solutions
Overestimating impact: Teams often overestimate how much a feature will move metrics. Counter this by using historical data and being conservative with impact scores.
Underestimating effort: Development teams frequently underestimate implementation complexity. Involve engineers early in effort estimation and add buffer for unexpected challenges.
Analysis paralysis: Don't let perfect data prevent action. Use the best available information and update scores as you learn more.
Streamline Your RICE Analysis with ClipMind
Manually calculating and comparing RICE scores across multiple features can become complex. ClipMind offers an AI-powered RICE Analyzer that helps you visualize your prioritization decisions and collaborate with your team more effectively.
The tool allows you to input your reach, impact, confidence, and effort estimates, then automatically calculates and ranks your features. You can export your RICE analysis as a mind map to share with stakeholders or integrate with your product roadmap.
RICE scoring transforms subjective prioritization into an objective, repeatable process. By systematically evaluating features against reach, impact, confidence, and effort, you can ensure your team builds what matters most to your users and your business.