The product manager sits at their desk, surrounded by the artifacts of their craft: a sprawling spreadsheet of user feedback, a dense strategy memo from leadership, a dozen open tabs of competitor analysis, and a blinking cursor in a blank Google Doc titled “PRD_v3_final_final.docx.” The task is to synthesize, to plan, to define. Yet, the very tools meant to facilitate this—linear documents, rigid roadmaps, siloed task managers—feel like a cognitive straitjacket. They demand that fluid, interconnected systems of thought be poured into sequential paragraphs and fixed-date columns. The translation itself becomes the work, consuming the energy meant for the thinking.
This is the core tension of modern product management. We are hired for our strategic, relational thinking—our ability to see how market shifts connect to technical constraints, how user pain points inform feature priorities. But we are measured by our ability to produce linear, structured outputs: the roadmap, the PRD, the presentation. The gap between how we think and how we are forced to document creates a silent tax on our cognitive capacity. Studies in cognitive neuroscience confirm that this constant context switching between relational strategy and linear documentation carries a significant cost, depleting the mental resources needed for deep analysis.
What if our primary thinking tool didn’t fight our natural cognition but augmented it? What if, instead of starting with a blank page, we started with a blank canvas that mirrored the associative nature of our minds? This is the promise of moving beyond documents to maps—not as decorative final outputs, but as dynamic thinking interfaces for strategy, planning, and creation.
The Product Manager's Cognitive Dilemma: Structure vs. Fluidity
The product mind does not work in bullet points. It works in clusters, connections, and hierarchies. A conversation with an engineer about a technical limitation sparks a memory of a user interview, which challenges an assumption in the business strategy. This is associative thinking, the kind Vannevar Bush envisioned when he described the “memex” as a device for augmenting the human intellect by fitting the “speed of thought” to the “speed of retrieval.”
Our current tools fail this test. A PRD is a frozen snapshot, difficult to update without breaking its narrative flow. A Gantt chart roadmap implies a certainty that betrays the reality of discovery and adaptation. The cognitive load of constantly translating a networked mental model into these linear formats is immense. It’s little wonder that surveys indicate only 28% of product managers report spending time on actual strategizing, with the remainder consumed by the administrative overhead of documentation and coordination.
The thesis is simple yet profound: the mind map can serve as the “source of truth” for product thinking. It is the native format for our cognition. From this central, editable map, the various required linear artifacts—the PRD document, the executive summary, the sprint briefing—can be generated, derived, or exported. The map is the living system; the documents are its reports.
Strategy as a Map, Not a Document
Consider the traditional strategy artifact: a 30-slide PowerPoint or a 10-page memo. It is a sequence of arguments, meant to be consumed from start to finish. Its linearity hides relationships. The connection between a competitor’s move on slide 8 and a core risk on slide 15 is left for the reader to infer.
Now, imagine the strategy as a map.
                     [Product Vision]
                          /    |    \
                         /     |     \
                [Market]    [Product]    [Business]
                   / \        /   \        / \
                  /   \      /     \      /   \
          [Competitors] [Trends] [Value Prop] [Risks] [Metrics] [Model]
At the center is the Product Vision. Radiating out are not slides, but primary branches: Market, Product, Business. From the Market branch, you grow sub-branches for competitor analysis, user segment deep-dives, and emerging trends. The Product branch holds value propositions, key differentiators, and architectural pillars. The Business branch outlines success metrics, revenue models, and strategic risks.
The visual advantage is transformative. You see the entire strategic landscape at once. The weak link—a value proposition with no clear differentiator against a key competitor—becomes glaringly obvious. An opportunity—a market trend that aligns perfectly with a technical strength—practically announces itself. This is the difference between a list of driving directions and a topographic map. The list gives you a single path; the map shows you the terrain, allowing you to navigate, reroute, and understand your position in the wider world.
Dynamic Planning: From Roadmap to Possibility Space
The traditional roadmap is a contract, a set of promises etched in time. It breeds rigidity. When a key experiment fails or a new opportunity emerges, updating the roadmap feels like a failure of planning, triggering renegotiations and stakeholder anxiety.
A mind map reimagines the roadmap as a possibility space. The central node is the Product Goal or North Star Metric. The primary branches are not timelines, but Themes or Outcome Areas (e.g., “Increase User Activation,” “Reduce Support Burden,” “Explore New Monetization”).
Features, experiments, and initiatives are attached to these themes. Visual language does the heavy lifting: color codes for priority (red for high, blue for future), iconography for status (a checkmark for done, a lightbulb for discovery), and border styles for confidence (dashed for speculative, solid for committed).
This creates a living artifact. When user feedback indicates an activation feature isn’t working, you don’t redraw the entire Gantt chart. You reprioritize nodes within the “Activation” theme, or move them to the “Backlog” branch. The structure accommodates change; it’s built for it. This aligns with Andy Matuschak’s concept of “evergreen notes”—planning artifacts should be continuously updatable knowledge, not periodically rewritten documents. PMs express frustration that traditional tools like Jira or Asana are poor at communicating strategic intent and adapting to new learning. A map solves for both.
The Living PRD: A Collaborative Thinking Artifact
The Product Requirements Document is often a tomb for ideas. By the time it’s “finished,” it’s already outdated. It’s also a terrible medium for collaborative ideation; it’s a document to be reviewed, not a space to be built within.
A mind map PRD inverts this model. The central node is the Feature or Initiative. Core branches radiate out:
- Problem & Context: Links to user research maps, data dashboards, and the strategic themes this addresses.
- Success Metrics: Defined outcomes, with links to how they’ll be measured.
- User Stories & Jobs-to-be-Done: A branch per persona or job, expanding into specific narratives.
- Solution Scope & Specifications: Technical and design constraints, linked out to Figma frames or architectural diagrams.
- Open Questions & Risks: A living log of uncertainties and mitigation plans.
This format invites collaboration. An engineer can directly add a “Technical Constraints” child node. A designer can link a branch to a prototype. The non-linear exploration is the point. Discussing “Success Metrics” might reveal a flaw in the “Problem” definition; the map makes this connection a single click, not a search through pages 3 and 7.
The map is the workshop where the product is reasoned about; the exported document is the showroom where the finished plan is displayed.
The final step is crucial: from this collaborative map, a clean, formatted Markdown or PDF PRD can be auto-generated for formal sign-off. The map remains the editable source of truth; the document is a snapshot for distribution.
Integrating AI: From Information Synthesis to Thought Partnership
The modern PM is drowning in unstructured data: user interview transcripts, support ticket logs, market reports, and internal strategy PDFs. The most time-consuming synthesis tasks—like clustering feedback from twenty interview transcripts—are prime for augmentation.
This is where AI-powered mind mapping shifts from a nice-to-have to a cognitive necessity. It acts first as a synthesis engine. Imagine pasting 50 user interview transcripts into a tool and generating a mind map where the primary branches are emergent pain point clusters, and child nodes are direct, attributed quotes. Suddenly, patterns are visible, not buried.
But the deeper value is AI as a thought partner within the map. This moves beyond summarization to active reasoning support. On your strategy map, you could ask the AI: “For this ‘Market Trend’ node, generate three potential product responses.” In your PRD map, you could select the “User Stories” branch and prompt: “Expand this into alternative flows for edge cases.” The AI populates and suggests structure within your cognitive model. You remain the architect, using AI to stress-test, expand, and refine the architecture of your thinking. This embodies Bret Victor’s principle of “explorable explanations”—the map becomes an environment for reasoning about the product, dynamically augmented by AI.
A Practical Workflow: From Chaos to Clarity
How does this work in practice? Let’s walk through a new initiative:
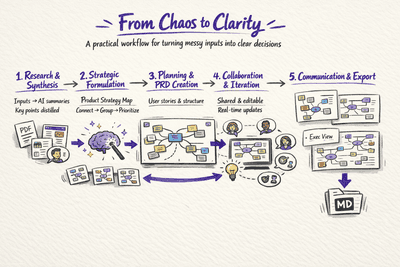
- Research & Synthesis: Use an AI tool to summarize your source materials. For example, with ClipMind, you can feed it the strategy PDF, the top five competitor webpages, and a folder of user research interviews. It generates individual summary mind maps for each, distilling key points.
- Strategic Formulation: Create a new, central “Product Strategy” map. Drag and drop key nodes from your research maps into this new canvas. Manually build the hierarchy—connecting a competitor feature to a market trend, grouping user pains into opportunity themes.
- Planning & PRD Creation: Create a new map for the specific initiative. Use your strategy map as a reference. Invoke an AI assistant within the tool to brainstorm user stories based on the “Opportunity Themes” you defined. Structure the PRD branches (Problem, Metrics, Stories, etc.).
- Collaboration & Iteration: Share the editable map link with your core team. In real-time, they can add comments, attach technical spec documents, and update status icons. The plan evolves visually and collaboratively.
- Communication & Export: Use different layouts—a clean, high-level view for leadership review; a detailed, dense view for engineering scoping. Finally, export the “Solution Scope” branch as a Markdown document to be integrated into your team’s wiki.
Reclaiming the Craft of Product Thinking
This is not about creating more diagrams. It is about choosing a tool that finally aligns with the non-linear, associative, and systemic nature of product thinking. It is a shift from seeing documents as endpoints to treating maps as thinking environments.
The goal is greater cognitive ergonomics—reducing the immense friction between having an insight and structuring it for execution and communication. When your primary tool mirrors the shape of your thoughts, you spend less time translating and more time thinking. You reclaim the strategic time surveys show you’re missing. The best product tool isn’t the one with the most features; it’s the one that gets out of the way of your thinking while helping you see its connections more clearly. It turns the chaos of information into a map you can navigate, together.